2D Spectrum Viewer
Note
This feature can be called at any point past the reduction step. The reason why it is presented at this point in the pipeline is because no further processing on the frames can be done after the sky subtraction.
Quick Start
To show a calibrated 2D spectrum, use the following command:
pylongslit_2dspec PATH_TO_CONFIG_FILE
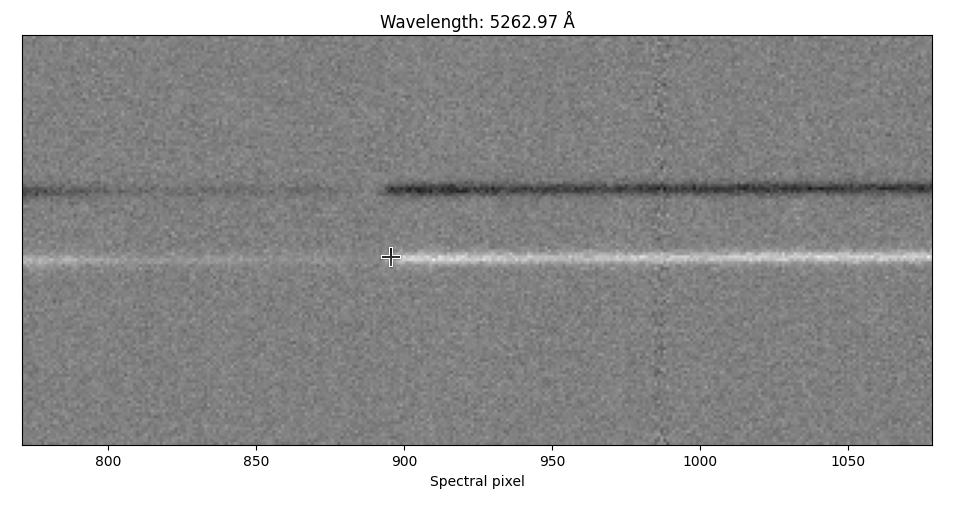
This will show all the reduced 2D spectra in the output directory specified in
the configuration file. You can hover the cursor over the 2D spectrum to see the
wavelength values at the top of the image. You can press h to
normalize the 2D spectrum to see the structure more clearly:

Modelled sky-subtraction ← Previous pipeline step
Next pipeline step → Object tracing